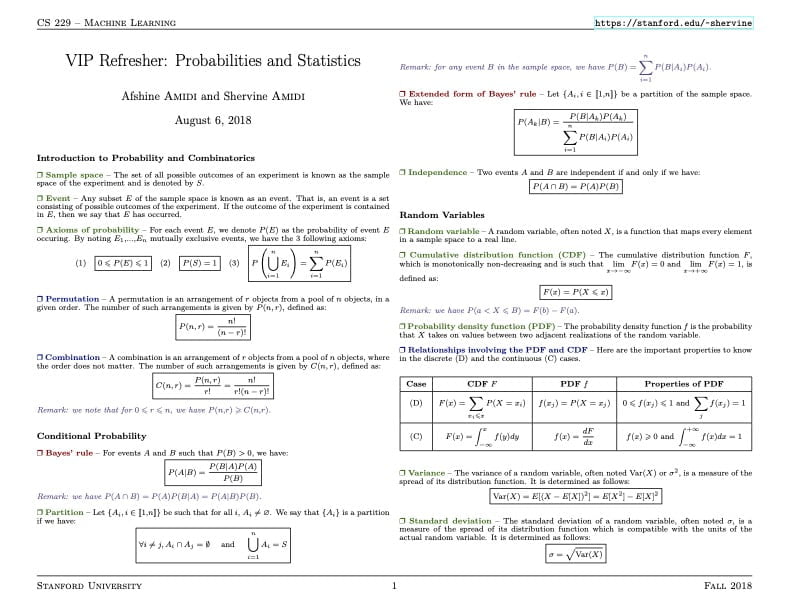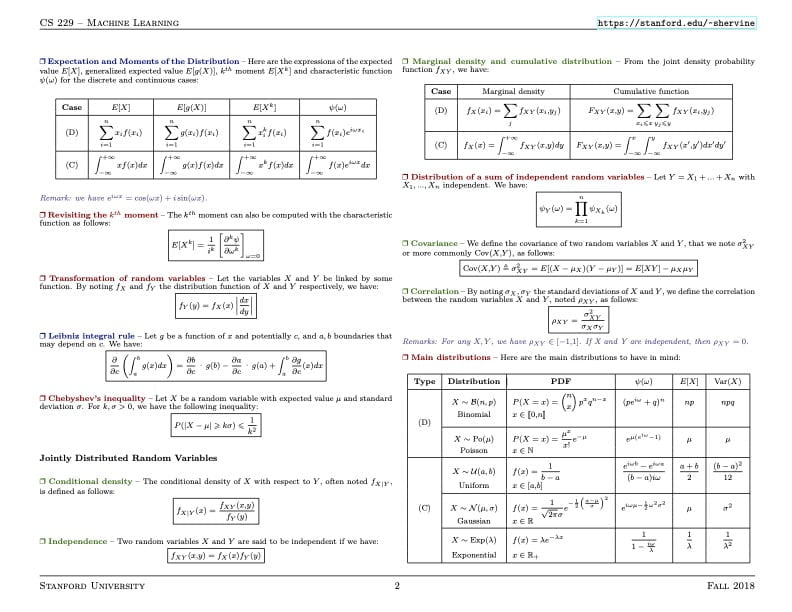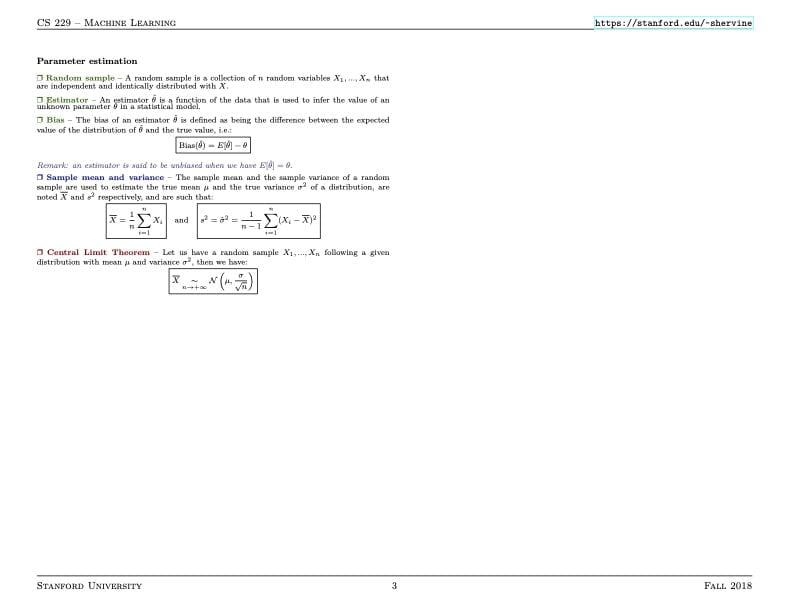
Do you want to gain a thorough understanding of probability and statistics formulas, which are most commonly utilized in Machine Learning? Then this cheat sheet is perfect for you to start with.
Table of Contents
Introduction
Probability and statistics are fundamental concepts in mathematics, data science, and various other fields. Whether you’re a student, a researcher, or a professional, having a solid understanding of these formulas can be incredibly useful. In this post, we’ve compiled an ultimate cheat sheet of essential formulas in probability and statistics to help you navigate through these concepts with ease. Understanding the probability and statistics is your first secret weapon to consider! Here’s why:
- Quantifying Uncertainty:
- Probability helps us express uncertainty. Whether it’s predicting stock prices or diagnosing diseases, knowing the likelihood of events is crucial.
- Random Variables and Distributions:
- Random variables model uncertain quantities. Distributions (like the Gaussian or Binomial) describe their behavior.
- Imagine fitting a Gaussian curve to data points—voilà, you’re doing statistics!
- Maximum Likelihood Estimation (MLE):
- MLE finds the best-fitting parameters for a model. Think of it as finding the most probable explanation for your data.
- Hypothesis Testing:
- Statistics lets us test hypotheses. Is that new drug effective? Run a statistical test to find out!
- Regression and Confidence Intervals:
- Linear regression? It’s all about minimizing errors. Confidence intervals tell us how sure we are about our estimates.
Remember, data science isn’t complete without these twin pillars—probability and statistics!
Probability
Probability deals with the likelihood of occurring of any events, assigning a measure between 0 and 1 to quantify the uncertainty. With the use of probability we can understand the chances of various outcomes in uncertain situations, such as predicting sales or angame results.
Probability Formulas:
- Basic Probability: P(A) = n(A) / n(S), where P(A) is the probability of event A, n(A) is the number of favorable outcomes, and n(S) is the total number of possible outcomes.
- Conditional Probability: P(A|B) = P(A ∩ B) / P(B), where P(A|B) is the probability of event A occurring given that event B has occurred, the probability of both A and B occurring is P(A ∩ B) whereas the likelihood that event B will occur is P(B)..
- Multiplication Rule: P(A ∩ B) = P(A) × P(B|A) = P(B) × P(A|B), where P(A ∩ B) is the probability of both events A and B occurring.
- Addition Rule: P(A ∪ B) = P(A) + P(B) – P(A ∩ B), where P(A ∪ B) is the probability of either event A or event B occurring.
Use in Data Science World
- Used to model uncertainty and randomness.
- Helps to estimate probabilities of events (e.g., click-through rates, customer churn).
- Required for machine learning algorithms (e.g., Naive Bayes).
- Helps Bayesian inference and probabilistic modeling.
Statistics
Statistics encompasses the processes of gathering, analyzing, interpreting, presenting, and structuring data. It offers techniques for drawing conclusions about entire populations based on sample information. In a broader sense, statistics helps quantify uncertainty and variation in data, enabling researchers, analysts, and decision-makers to draw meaningful conclusions and make informed decisions.
Descriptive Statistics Formulas:
- Mean: μ = Σ(x × f) / n, where μ is the mean, x is the individual data point, f is the frequency of x, and n is the total number of data points.
- Median: a sorted set of data points’ middle value.
- Mode: the value or values that are most common in a set of data.
- Range: Range is the Maximum value – Minimum value.
- Variance: σ² = Σ(x – μ)² × f / n, where σ² is the variance, x is the individual data point, μ is the mean, f is the frequency of x, and n is the total number of data points.
- Standard Deviation: σ = √(σ²), where σ is the standard deviation, and σ² is the variance.
Inferential Statistics Formulas:
- Z-score: Z = (x – μ) / σ, where Z is the z-score, x is the individual data point, μ is the population mean, and σ is the population standard deviation.
- Confidence Interval for a Mean: μ ∈ x̄ ± z(α/2) × (σ / √n), where n is the sample size, σ is the population standard deviation, z(α/2) is the critical value from the standard normal distribution, x̄ is the sample mean, and μ is the population mean.
- Hypothesis Testing (One-Sample Z-test): Z = (x̄ – μ) / (σ / √n), where x̄ is the sample mean, μ is the hypothesized population mean, σ is the population standard deviation, and n is the sample size.
- Correlation Coefficient (Pearson’s r): r = Σ[(x – x̄)(y – ȳ)] / √[Σ(x – x̄)² × Σ(y – ȳ)²], where r is the correlation coefficient, x and y are the individual data points, x̄ and ȳ are the respective sample means.
- Linear Regression: y = a + bx, where y is the dependent variable, x is the independent variable, a is the y-intercept, and b is the slope of the line.
Use in Data Science World
- Provides tools for data exploration and hypothesis testing.
- Helps summarize data (mean, variance, etc.).
- Supports regression analysis, and t-tests.
- Validates different models and assesses their performance.
Probability and Statistics: Comparison
| Aspect | Probability | Statistics |
|---|---|---|
| Definition | It is a theoretical branch of mathematics | This is an applied branch of mathematics. |
| Focus | It predicts likelihood of future events. | It analyzes frequency of past events. |
| Data Usage | It uses known parameters to predict data. | It help draws inferences from the observed data. |
| Application Example | Can help predicting natural disasters, card games. | Helps to get confidence intervals and hypothesis testing. |
| Nature | It is more theoretical and abstract. | It is more practical and applied. |
Probability and Statistics: Cheat Sheet


Summary
Remember that probability deals with predicting future events based on existing data, while statistics draws conclusions about a larger population using sample data. This cheat sheet covers some of the most commonly used formulas in probability and statistics. However, it’s important to note that these formulas should be applied with a deep understanding of the underlying concepts and assumptions. If you’re new to these topics, we recommend seeking guidance from a qualified instructor or consulting reputable resources for a more comprehensive understanding.
Learn more about related topics
- Data Science Cheat Sheets
- Deep Learning Cheat Sheets
- Algebra and Calculus
- Statistics and Probability by Khan Academy
